This year marks the 21st release of the school grades in Florida, and now more than ever it is clear that rather than being a cause for celebration, these manufactured grades should be a call for a revolution — one that focuses on ensuring all students and educators have the resources necessary for a world-class education regardless of ZIP code or poverty level.
The annual tradition of assigning grades to schools has been happening for two decades now, so many Floridians — including teachers, parents, and students — have come to see the Florida Department of Education ranking (and shaming) schools as a normal thing.
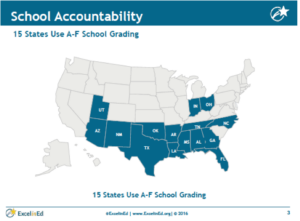
Part of the reason that 70 percent of states don’t grade schools is because ranking schools on an A-F system has few, if any, tangible benefits for students.
That is, unless you consider having schools ranked by the socioeconomic status of their students a benefit. In which case, there is really no better tool than Florida’s A-F system of school grades.
For instance, if you wanted to know the median income of each of Florida’s 67 counties, you could spend a lot of time looking at county profiles provided by the Office of Economic & Demographic Research. Or, you could look at the district grade provided by the Florida Department of Education.
As the chart below shows, you’d find the median income either way.
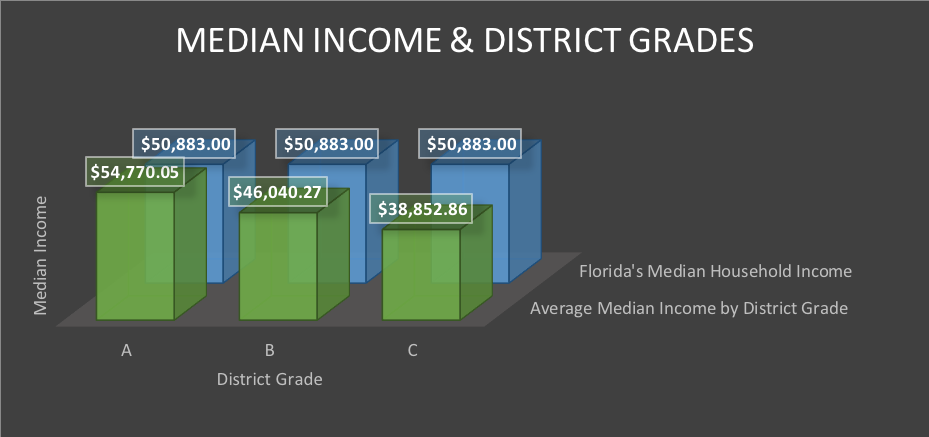
Did the district receive an A? If so, you can assume the median income there is higher there than the state’s median income of $50,883.
Looking at a district that was named a B? You’re likely looking at a county with a median income in the $40-50k range.
And you guessed it, 11 of the 14 districts with a C have a median household income in the $30k range. (Note: There are currently not any districts with a D or F grade.)
There are, of course, a few outliers, but for the most part when the median household income and each district’s percentage grade are plotted on the same chart, they line up remarkably well.
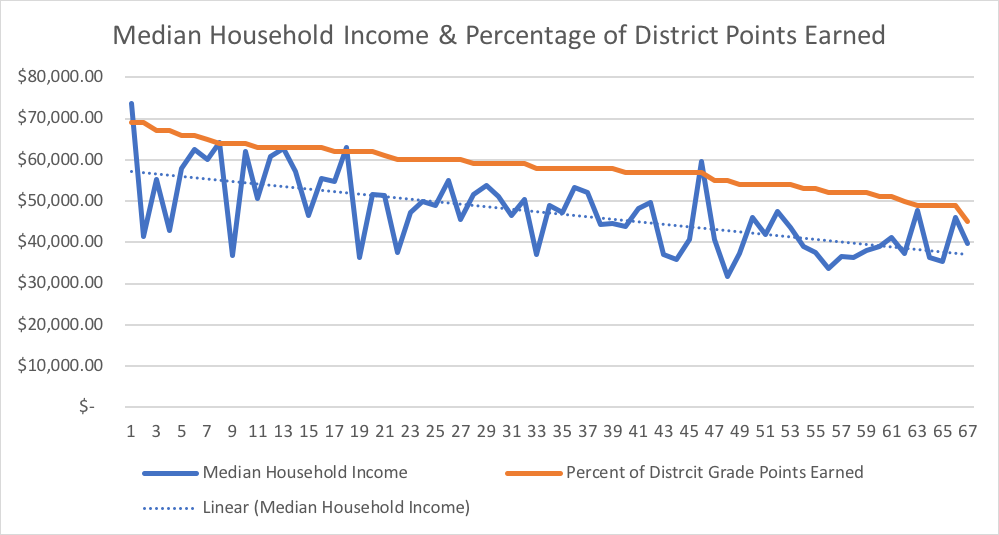
The trend for districts holds true for individual schools within those districts as well. This is not a surprise to anyone who works in the field of education. We do not pretend that this is some new revelation.
But as we anticipate the release of school grades in the coming weeks, we feel it is essential to point out to those outside of education what exactly it is these grades are truly measuring: the socioeconomic status (SES) of the students in each school.
Schools assigned a grade of A have, on average, just less than half of their students living in poverty. On the other side of the scale, for D and F schools, the poverty rate is over 90 percent.
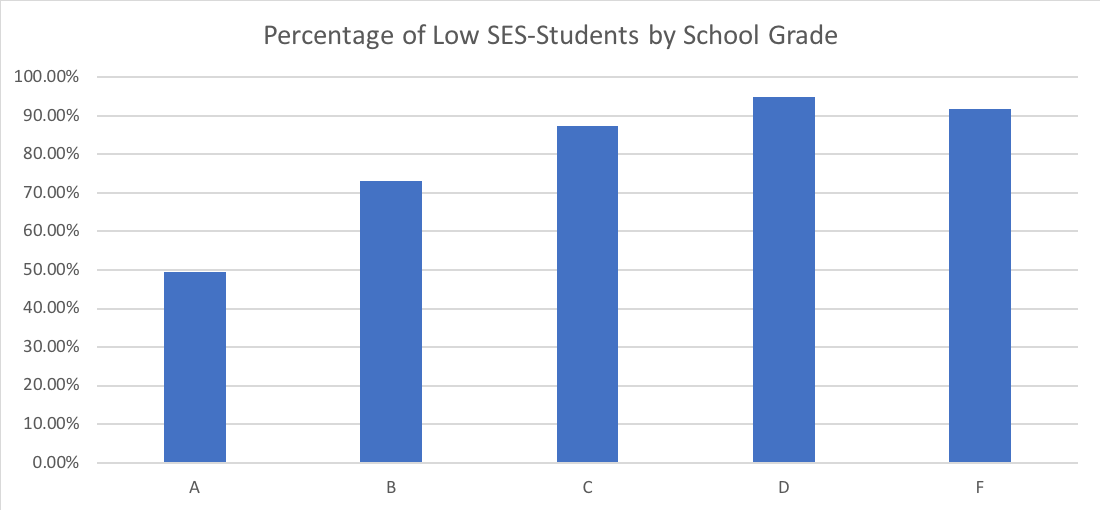
You might notice that while schools receiving a D and F both have poverty rates of over 90 percent, the poverty rate is actually slightly lower for schools that received an F. It’s important to note the sample size is incredibly small. Only 35 out of the 3,313 graded schools received an F — and the majority of those (25) were elementary schools.
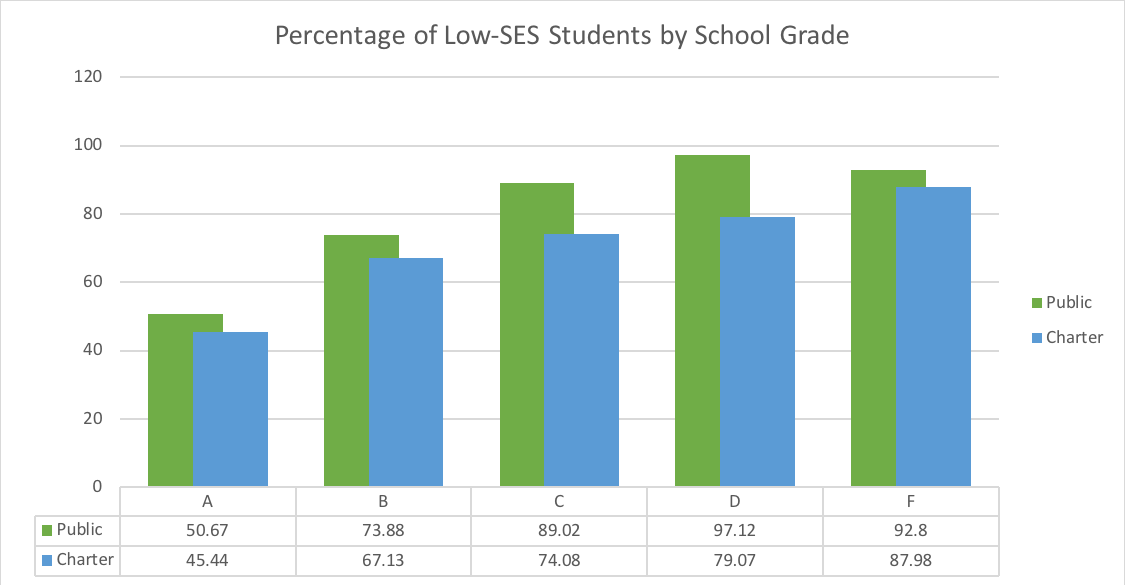
The poverty-level school grade trajectory becomes even more interesting when the data is broken down between public schools and charter schools.
Again, the below information will not be a surprise to anyone who works in education — we all know part of the charter schools’ business model is to teach fewer students who live in poverty — but it is important data, nonetheless.
While school grades are related to low socioeconomic status for both public schools and charter schools, public schools with a higher percentage of students living in poverty actually receive better grades than charter schools with a comparable percentage of high-poverty students. For instance, with an average poverty rate of 74 percent, public schools are rated as a B compared to charter schools with a C.
One final note (for now) on school grades. Not content with merely labeling high-poverty schools as a D or F, a few years back the Legislature decided they would shame elementary schools in a new way: naming them the 300 lowest performing schools. If you’ve made it this far in the blog, it should come as no surprise that the “lowest performing schools” have an average poverty rate of 98 percent.
However, that’s not to say there is nothing surprising in the list of the lowest-performing schools. Table 1 below shows each school for the past five years that has the distinction of being named one of the state’s lowest performing schools while also being named either an A or B school.
There is perhaps nothing that better undermines the idea that school grades have any meaning than when the Department of Education assigns an A grade to Pleasant City Elementary (97 percent of students living in poverty), Earlington Heights Elementary (98.4 percent students living in poverty), and George W. Munroe Elementary (100 percent students living in poverty), but still feels the need to shame these schools by calling them amongst the lowest-performing in the state. These two measures cannot be simultaneously correct, and we’d argue neither of them provide meaningful data for helping to ensure student success.
When school grades come out this summer, we already know what the results will be. A handful of schools might be assigned a different grade from the state, but the systemic inequality will remain.
There has been no Florida miracle. Despite some improvement Florida is underperforming in results and there has been harm.
Monroe County public school advocate Dr. Sue Woltanski sums it well in an online comment:
“I have watched education reforms, like testing, 3rd grade retention, A-F grading, VAM, Common Core, decimate the quality of education in my children’s public schools. I live in an A district with essentially all A schools, yet still the damage of these so-called reforms is obvious. There is less art, music, PE, Spanish now than when my children started kindergarten. Writing instruction is almost entirely formulaic and focused on passing the FSA Writing portion. In my community, despite having some very good teachers, both charters and traditional public schools are over obsessed with data points, are constantly assessing children and focus primarily on state assessments. In small rural communities like mine, one can watch the neighborhood charter entice the bright, resourced children away from the traditional public school, while sending the poorly behaved, low test score or under-resourced ones back to the TPS. So forgive me if I don’t trust those who have created all this over the last 20 years, including those official state academic evaluators, to repair the damage done to my schools by their actions. The School Choice folk like to distance themselves from the test and punish/data mining/accountability monster, but those of us that have been watching know they are one and the same. The monster has already caused massive destruction to our schools and, since you have been involved since early on, you know it is all part of the plan. Defund the public schools, use standardized tests to label them as failing, so that people will leave them for tiny new “choice” options. Everything is going according to plan. Privatize on.”
We measure poverty at the expense of all that public education could be.
Let us be clear: As long as school grades remain, they are better suited to inform the public about the income of the school’s neighborhood than the power and potential of the students and educators in the school.
And for that the Florida Department of Education and state Legislature deserve an F.
Table 1. Florida schools that have been named one of the lowest performing schools and been named an A or B school, 2013-2018.
| School Year | School Name | Grade |
| 2013-14 & 2014-15* | RUTLEDGE H. PEARSON ELEMENTARY SCHOOL | B |
| HIGHLANDS ELEMENTARY SCHOOL | B | |
| ARLINGTON HEIGHTS ELEMENTARY SCHOOL | B | |
| PHYLLIS WHEATLEY ELEMENTARY | B | |
| ECCLESTON ELEMENTARY | B | |
| LAKE PARK ELEMENTARY SCHOOL | B | |
| BARTON ELEMENTARY SCHOOL | B | |
| PLEASANT CITY ELEMENTARY SCHOOL | A | |
| POLK AVENUE ELEMENTARY SCHOOL | B | |
| WESTSIDE ELEMENTARY SCHOOL | B | |
| 2015-16 | LOUISE S. MCINNIS ELEMENTARY SCHOOL | B |
| 2016-17 | DEERFIELD PARK ELEMENTARY SCHOOL | B |
| PARKSIDE ELEMENTARY SCHOOL | B | |
| NIBLACK ELEMENTARY SCHOOL | B | |
| LAURA C. SAUNDERS ELEMENTARY SCHOOL | B | |
| JESSE J. MCCRARY, JR. ELEMENTARY SCHOOL | B | |
| SANTA CLARA ELEMENTARY SCHOOL | B | |
| JAMES STEPHENS INTERNATIONAL ACADEMY | B | |
| JAMES TILLMAN ELEMENTARY MAGNET SCHOOL | B | |
| LAKE PARK ELEMENTARY SCHOOL | B | |
| HIGH POINT ELEMENTARY SCHOOL | B | |
| WAHNETA ELEMENTARY SCHOOL | B | |
| 2017-18 | EARLINGTON HEIGHTS ELEMENTARY SCHOOL | A |
| GEORGE W. MUNROE ELEMENTARY SCHOOL | A | |
| JESSE J. MCCRARY, JR. ELEMENTARY SCHOOL | B | |
| JAMES TILLMAN ELEMENTARY MAGNET SCHOOL | B | |
| LOUISE S. MCINNIS ELEMENTARY SCHOOL | B | |
| WESTWOOD HEIGHTS ELEMENTARY SCHOOL | B | |
| PARKVIEW ELEMENTARY SCHOOL | B | |
| LAKE LUCINA ELEMENTARY SCHOOL | B | |
| STEWART STREET ELEMENTARY SCHOOL | B | |
| ROOSEVELT ELEMENTARY SCHOOL | B | |
| TOUSSAINT L'OUVERTURE ELEMENTARY | B | |
| PINE VILLA ELEMENTARY SCHOOL | B | |
| WEST RIVIERA ELEMENTARY SCHOOL | B |
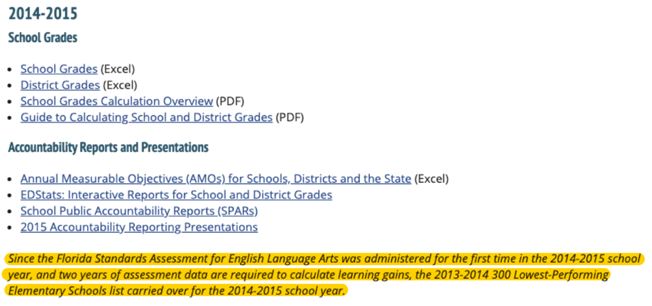
* 2014-15 was the first year the Florida Standards Assessment (FSA) replaced the Florida Comprehensive Assessment Test (FCAT). Because of the change in test, the Department of Education decided not to generate a new list of lowest 300 performing schools in 2014-15. Instead, they just declared the 2013-14 schools to once again be the lowest performers. Seriously.
